How to Feed Historical 1 minute stock data nse to Amibroker

How to Feed Historical 1 minute stock data nse to Amibroker

High-frequency trading and algorithmic strategies demand precision, and historical 1-minute stock data is the backbone of such analysis. For traders and researchers focused on India’s National Stock Exchange (NSE), Amiprofits has emerged as a leading Amibroker data feed provider of ultra-detailed, reliable historical intraday data. Their datasets empower users to backtest strategies, refine algorithms, and uncover market patterns with unparalleled granularity.

Table of Contents

Why 1-Minute NSE Data Matters?

1-minute data captures price movements, volume trends, and order flow at 60-second intervals, offering a microscopic view of market behavior. This resolution is critical for

  • Intraday strategy development: Identifying short-term price patterns or momentum shifts.
  • Algorithmic trading: Training models to execute trades based on real-time signals.
  • Risk management: Simulating slippage and liquidity conditions under historical scenarios.

Traditional end-of-day (EOD) data lacks the temporal depth needed for high-frequency analysis, making 1-minute datasets indispensable for modern traders.

Challenges in Sourcing Reliable Historical Data

Many free or low-cost datasets suffer from critical flaws

  • Incomplete records: Missing ticks or irregular time intervals.
  • Unadjusted prices: Failure to account for corporate actions like splits or dividends.
  • Formatting issues: Incompatibility with platforms like Amibroker, requiring manual cleanup.

These limitations waste time and compromise strategy accuracy.

Amiprofits’ Solution: Precision Data for Discerning Traders

Amiprofits addresses these challenges with rigorously curated historical 1-minute NSE data, featuring:

✔️ Minute by Minute accuracy

Our datasets replicate exact exchange ticker feeds, including bid/ask quotes and trade prices, ensuring alignment with real market conditions.

✔️ 20 years of historical depth

Access minute-level data spanning decades, enabling long-term backtesting and regime analysis.

✔️ Seamless Amibroker integration

Preformatted files load directly into Amibroker without adjustments, saving hours of data wrangling.

✔️ Corporate action adjustments

Automatic adjustments for dividends, splits, and mergers ensure a consistent price series.

✔️ Broad coverage

Includes equity,futures,commodity,options,mcx and more segments, and derivatives, with metadata like volume and open interest.

Use Cases Enabled by Amiprofits’ Amibroker Data Feed

  1. Strategy Backtesting
    Validate intraday mean-reversion or breakout strategies across multiple market cycles.
  2. Volatility Analysis
    Study intraday volatility clustering using GARCH models or machine learning.
  3. Liquidity Profiling
    Map historical bid-ask spreads to optimize execution algorithms.
  4. Event Studies
    Analyze minute-level price reactions to earnings announcements or macroeconomic news.

Getting Started with Amiprofits

Amiprofits simplifies access through flexible plans

  • Cost-effective tiers: Starting at ₹419/month for NSE equity data.
  • Bulk discounts: For institutions requiring multi-year datasets.
  • Free demos: Test data quality with 5-day sample feeds.

The setup process is streamlined:

  1. Download the AmiProfits Amibroker Data Feed software by watching the tutorial.
  2. Select desired NSE instruments and time ranges.
  3. Automatically backfill historical data into Amibroker.

Conclusion

In algorithmic trading, data quality dictates strategy performance. Amiprofits’ historical 1-minute NSE datasets eliminate the noise plaguing free alternatives, providing a robust foundation for quantitative research. By combining exchange-grade accuracy with user-friendly delivery, they enable traders to focus on innovation rather than data cleanup. For anyone serious about intraday analysis, Amiprofits offers an unmatched blend of depth, reliability, and convenience

feed mcx live data to amibroker

How to Feed MCX Live Data to AmiBroker: A Step-by-Step Guide

Table of Contents

If you want to make an informed decision in today’s fast-paced trading environment, then having access to real time data feed for amibroker is crucial. For traders using AmiBroker, a powerful charting and technical analysis platform, integrating live data from exchanges like the Multi Commodity Exchange (MCX) can significantly enhance their trading strategies. One of the most reliable ways to achieve this is by using AmiProfits, a popular Amibroker data feed provider that supports MCX live data. In this blog, we will walk you through the process of feeding MCX live data to AmiBroker via AmiProfits, ensuring you stay ahead in your trading journey.

Why Use MCX Live Data with AmiBroker?

Let us briefly understand why integrating MCX live data into AmiBroker is essential before diving into the technical steps.

  1. You can get the Real-Time Insights. Yes, Live data ensures you are always working with the latest market information that enables timely decision-making.
  2. Next, you can do an accurate analysis. Historical and live data combined provide a comprehensive view of market trends, helping you identify patterns and opportunities.
  3. With live data, you can automate your trading strategies using AmiBroker AFL (AmiBroker Formula Language) scripts.
  4. Access to accurate and up-to-date data gives you an edge over traders relying on delayed or incomplete information.

Now that we have established the importance of amibroker live data. So, let’s move on to the step-by-step guide.

Understand AmiBroker and Amiprofits

AmiBroker is a sophisticated platform designed for technical analysis, backtesting trading strategies, and scanning markets for opportunities. It provides users with tools to analyze price movements and trends effectively. However, AmiBroker does not come with a built-in data feed; users must source this from third-party providers.

Amiprofits is one such provider that specializes in delivering high-quality Amibroker data feeds specifically tailored for AmiBroker. They offer a comprehensive package that includes tick-by-tick data for various segments, including equity, futures, commodities, indices, currencies, and options. With over 2000 symbols available and a commitment to 99.5% uptime, Amiprofits ensures traders have access to the information they need without interruptions.

Benefits of Using Amiprofits for MCX Data

  1. Amiprofits provides tick by tick updates allows traders to react instantly to market movements.
  2. Extensive Symbol Coverage with over 2000 symbols available, traders can track various instruments across different market segments.
  3. High Data Quality service is backed by multiple dedicated servers that ensure data integrity and reliability.
  4. Amiprofits offers straightforward installation procedures along with video tutorials and customer support to assist users.

Step-by-Step Guide to Feed MCX Live Data into AmiBroker

Step 1: Subscribe to Amiprofits

You need to subscribe to Amiprofits Amibroker data feed service to get started. They offer various plans depending on your needs. ( sign up 3 days fee demo )

  • 250 Symbols
  • 500 Symbols
  • 750 Symbols
  • 1000 Symbols
  • Unlimited Symbols

Choose a plan that suits your trading style and your budget.

Step 2: Download and Install the Amiprofits Software

  1. Visit the Amiprofits website and download the installation package for our Amibroker data feed application.
  2. Run the installer and follow the prompts to complete the installation process.
  3. After installation, launch the application.

Step 3: Configure Amibroker Data Feed Settings in AmiBroker

  1. Open AmiBroker.
  2. Navigate to File -> New Database and create a new database where your data will be stored.
  3. Go to Tools -> Preferences, then select the Data tab.
  4. In the Data Source section, choose local datbase as your Amibroker Data feed provider.
  5. Enter your subscription details (username/password) if prompted.

Step 4: Set Up Real-Time Data Streaming

  1. In the Amiprofits application, ensure that you are connected to the internet and logged in.
  2. Select and add the symbols you wish to track in your AmiBroker watchlist, backfill minimum 10 days
  3. Configure any additional settings such as backfill options (Amiprofits offers amibroker backfill data for up to 365 days and eod historical data for last 20 years ).

Step 5: Verify Amibroker Data Feed Connection

  1. Return to AmiBroker and check if the live data is being updated in real-time.
  2. You can create charts or use pre-built AFL (AmiBroker Formula Language) scripts provided by Amiprofits to analyze market trends.

Utilizing AFLs for Enhanced Trading Strategies

Amiprofits also provides over 5000 free Amibroker AFLs that can help automate trading strategies or enhance analysis capabilities within AmiBroker.

  • Use AFLs designed to identify bullish or bearish trends based on historical price movements.
  • Implement AFLs that generate buy/sell signals based on specific criteria or indicators.
  • Utilize AFLs that help set stop-loss levels or determine optimal entry/exit points.

Troubleshooting Common Issues

While setting up your Amibroker data feed with Amiprofits is generally straightforward, you may encounter some common issues

  • Ensure your internet connection is stable and that the Amiprofits application is running.
  • Check your subscription status and ensure you have selected the correct symbols in both AmiBroker and Amiprofits.
  • If you face issues during installation, refer to the video tutorials provided by Amiprofits or contact their customer support for assistance.

Conclusion

Integrating MCX live data into AmiBroker using Amiprofits can significantly enhance your trading experience by providing timely information needed for effective decision-making. With its user-friendly setup process and extensive symbol coverage, Amiprofits stands out as a reliable choice for traders looking to optimize their strategies with real-time data feeds.

By following this guide, you should be well on your way to leveraging live market data effectively in your trading endeavors. Don’t forget to explore the free AFLs offered by Amiprofits to further enhance your analysis capabilities within AmiBroker!

how to backtest on amibroker data feed

How to Backtest Trading Strategies Using Amibroker Data Feed

Table of Contents

Backtesting is a critical process for you as a trader or investor who wants to evaluate the effectiveness of your trading strategies before risking real capital. With the right tools and data, backtesting can provide you a valuable insights into the potential performance of a strategy. 

In this blog, we’ll explore how to backtest trading strategies using the Amibroker Data Feed, step by step. We’ll also discuss the importance of backtesting, common mistakes to avoid, and how to interpret the results.

What is Backtesting and Why is it Important?

Backtesting is like a “practice run” for your trading strategy. Imagine you have an idea for a trading strategy that maybe you want to buy stocks when their price goes above a certain level and sell when it drops below another level. 

But before you risk your real money, wouldn’t it be great to test if this idea actually works?


That is where backtesting comes in. It is a way to test your trading strategy using historical data – past prices of stocks, currencies, or any other asset. By simulating how your strategy would have performed in the past, you can see if it is profitable or not. Think of it as looking into a “time machine” to see how your strategy would have worked in real market conditions.

Why is Backtesting Important?

  1. Backtesting lets you test your strategy without risking a single dollar. It is like practicing in a safe environment before playing the real game.
  2. You can figure out what works and what doesn’t by testing your strategy. For example, you might discover that your strategy works well in trending markets but fails in sideways markets.
  3. Backtesting helps you fine-tune your strategy. You can adjust parameters (like stop-loss levels or entry points) to improve performance.
  4. If your strategy performs well in backtesting, you will feel more confident using it in real trading. On the other hand, if it performs poorly, you can go back to the drawing board and improve it.

The Role of the Amibroker Data Feed in Backtesting

You need accurate and reliable historical data to backtest effectively. This is where the Amibroker Data Feed comes in. It provides high-quality historical data, which is essential for getting realistic backtesting results.

  • Why is Data Quality Important?

If your historical data is incomplete or inaccurate, your backtesting results will be misleading. For example, if the data is missing some price movements, your strategy might appear more profitable than it actually is. The Amibroker Data Feed ensures that the data you use is clean, complete, and trustworthy.

  • Why Do Traders Trust Amibroker Data Feed?

The Amibroker Data Feed is known for its reliability and accuracy. Most of traders rely on it because it helps them make better decisions by providing realistic simulations of how their strategies would perform.

How to Import Historical Data into Amibroker

You need to import historical data into Amibroker before you can start backtesting. The Amibroker Data Feed supports a wide range of data formats that make it easy to import data from various sources. Here is how you can do it.

  • Prepare Your Data

First, you have to ensure your historical data is in a compatible format, such as CSV or ASCII. The data should include essential fields like date, open, high, low, close, and volume.

  • Open Amibroker

Next, launch the Amibroker application and create a new database or open an existing one of yours.

  • Import Data

Now, go to the File menu and select Import ASCII. Follow the prompts to map the data fields and import the file. The Amibroker Data Feed ensures that the data is accurately imported and ready for analysis.

  • Verify Data

Once imported, check the data for accuracy. You can use Amibroker’s charting tools to visualize the data and ensure there are no gaps or errors.

You can be confident that your historical data is clean, complete, and ready for backtesting by using the Amibroker Data Feed.

Step-by-Step Guide to Backtesting Strategies

Now that your data is imported, it is time to backtest your trading strategy. Here is a step-by-step guide to help you get started to backtest your trading strategy.

Step 1: Define Your Strategy

Before backtesting, clearly define your trading strategy. This includes entry and exit rules, position sizing, and any other parameters. For example, you might create a strategy that buys when a 50-day moving average crosses above a 200-day moving average and sells when the opposite occurs.

Step 2: Write the AFL Code

Amibroker uses its own scripting language called Amibroker AFL (AmiBroker Formula Language) to define trading strategies. Write the AFL code that represents your strategy. 

Step 3: Run the Backtest

Once your AFL code is ready, go to the Analysis menu and select Backtest. Amibroker will run the backtest using the historical data from the Amibroker Data Feed. The platform will simulate trades based on your strategy and generate a detailed report.

Step 4: Analyze the Results

After the backtest is complete, review the results. Amibroker provides a wealth of information, including metrics like net profit, drawdown, win rate, and risk-adjusted returns. These metrics will help you evaluate the performance of your strategy.

Step 5: Optimize Your Strategy

If the results are not satisfactory, consider optimizing your strategy. You can tweak parameters like stop-loss levels, take-profit targets, or moving average periods. Re-run the backtest to see if the changes improve performance.

Common Mistakes in Backtesting

While backtesting is a powerful tool, it is not without its pitfalls. Here are some common mistakes to avoid

  • Overfitting

This occurs when a strategy is overly optimized to perform well on historical data but fails in live markets. Avoid overfitting by keeping your strategy simple and testing it on out-of-sample data.

  • Ignoring Transaction Costs

Failing to account for transaction costs like commissions and slippage can lead to unrealistic results. The Amibroker Data Feed allows you to include these costs in your backtests for more accurate simulations.

  • Using Insufficient Data

Backtesting on a small dataset can produce unreliable results. Ensure you have enough historical data to capture different market conditions.

  • Ignoring Market Impact

If you are trading large positions, your trades can impact the market price. This effect is often overlooked in backtesting but can significantly affect real-world performance.

By being aware of these mistakes, you can ensure that your backtesting results are more reliable and actionable.

How to Interpret Backtesting Results

Interpreting backtesting results is a crucial step in the process. Here are some key metrics you have to focus on.

  • Net Profit

The total profit or loss generated by the strategy. A positive net profit indicates a potentially profitable strategy.

  • Drawdown

The maximum loss from a peak to a trough. A high drawdown indicates a higher risk.

  • Win Rate

The percentage of winning trades. A high win rate is desirable but not always necessary if the average winning trade is significantly larger than the average losing trade.

  • Risk-Adjusted Returns

Metrics like the Sharpe ratio or Sortino ratio help assess the return relative to the risk taken. Higher ratios indicate better risk-adjusted performance.

  • Trade Frequency

The number of trades generated by the strategy. High-frequency strategies may incur higher transaction costs.

By analyzing these metrics, you can gain a comprehensive understanding of your strategy’s performance and make informed decisions about its viability.

Conclusion

Backtesting trading strategies using the Amibroker Data Feed is an essential step for you as a trader looking to validate your ideas and improve your performance. By importing high-quality historical data, defining clear strategies, and avoiding common mistakes, you can generate reliable backtesting results that provide valuable insights.

The Amibroker Data Feed ensures that your backtesting process is based on accurate and comprehensive data, giving you the confidence to deploy your strategies in live markets. Whether you’re a beginner or an experienced trader, mastering the art of backtesting with Amibroker can significantly enhance your trading success.

So, take the time to backtest your strategies thoroughly, interpret the results carefully, and refine your approach. With the right tools and mindset, you’ll be well on your way to achieving your trading goals.

amibroker tick data

Why Amibroker Tick Data is Crucial for Backtesting and Live Trading?

In the  world of trading, getting your hands on accurate and timely data isn’t just helpful, it’s the difference between winning and losing. While there’s no shortage of data types to explore, tick data stands out in the crowd as the most granular and actionable resource for traders. When you combine the amibroker tick data with a powerhouse platform like AmiBroker, unlock a wealth of insights that can significantly enhance your trading strategy. Let’s break down what tick data is, why it’s indispensable, and how AmiBroker can help you to gain a competitive edge in the markets.

What is Amibroker Tick Data?

Tick data is the most detailed form of market data available. It records every single transaction that occurs in the market, including the price, volume, and time of each trade. Unlike candlestick or bar charts, which aggregate data over a specific time period (e.g., 1-minute, 5-minute, or daily), tick data provides a real-time, transaction-by-transaction view of market activity.

For example, if a stock trades 100 times in a single minute, tick data will capture all 100 transactions, whereas a 1-minute candlestick chart would only show the open, high, low, and close prices for that minute. This level of detail makes tick data an invaluable tool for traders who need to analyze market microstructure, identify patterns, and execute high-frequency trading strategies.

Why is Tick Data Important?

  1. Precision and Accuracy: Tick data provides the most accurate representation of market activity. It allows traders to see exactly how prices move, which is especially important in fast-moving markets where every second counts.
  2. Improved Strategy Development: By analyzing tick data, traders can develop more sophisticated trading strategies that take into account the nuances of market behavior. For example, tick data can help identify liquidity levels, detect order flow imbalances, and spot hidden patterns that are not visible on higher timeframes.
  3. Backtesting and Optimization: Tick data is essential for backtesting high-frequency trading strategies. Since these strategies often rely on small price movements and quick execution, using aggregated data (like candlestick charts) for backtesting can lead to inaccurate results. Tick data ensures that your backtests are as realistic as possible.
  4. Real-Time Decision Making: For day traders and scalpers, tick data is indispensable for making real-time trading decisions. It allows them to react quickly to market movements and capitalize on short-term opportunities.

How to Use Tick Data in AmiBroker

AmiBroker is a powerful trading platform that supports tick data analysis, making it a popular choice among traders who need to work with high-frequency data. Here’s how you can make the most of tick data in AmiBroker:

1. Importing Tick Data

The first step is to import tick data into AmiBroker. You can obtain tick data from various sources, including data vendors, brokers, or even directly from exchanges. Once you have the data, you can import it into AmiBroker using the built-in data import tools. AmiBroker supports a variety of data formats, so you should be able to import your tick data without any issues.

2. Visualizing Tick Data

After importing the data, you can visualize it using AmiBroker’s charting tools. While tick data is typically displayed as a series of individual trades, you can also aggregate it into smaller timeframes (e.g., 1-second or 1-minute charts) to get a clearer picture of market activity. AmiBroker’s flexible charting options allow you to customize the display to suit your needs.

3. Analyzing Tick Data

AmiBroker provides a wide range of technical analysis tools that you can use to analyze tick data. For example, you can use indicators like moving averages, RSI, or MACD to identify trends and potential entry/exit points. Additionally, AmiBroker AFL (AmiBroker Formula Language) allows you to create custom indicators and scripts tailored to your specific trading strategy.

4. Backtesting with Tick Data

One of the most powerful features of AmiBroker is its backtesting capabilities. With tick data, you can backtest high-frequency trading strategies with a high degree of accuracy. AmiBroker’s backtesting engine takes into account factors like slippage, commissions, and order execution, giving you a realistic assessment of how your strategy would perform in live trading.

5. Amibroker Real Time Tick Data

For traders who need real-time data, AmiBroker supports real-time tick data feeds from various brokers and data providers. This allows you to monitor the market in real-time and execute trades directly from the platform. Real-time tick data is particularly useful for day traders and scalpers who need to make quick decisions based on the latest market information.

Tips for Working with Tick Data in AmiBroker

  1. Data Quality Matters: The accuracy of your analysis depends on the quality of your tick data. Make sure to use a reliable data source and clean your data to remove any errors or inconsistencies.
  2. Optimize Your System: Tick data can be resource-intensive, especially when working with large datasets or running complex backtests. Make sure your computer has sufficient processing power and memory to handle the workload.
  3. Start Small: If you’re new to tick data, start with a small dataset and gradually work your way up. This will help you get familiar with the data and avoid getting overwhelmed.
  4. Combine with Other Data: While tick data is incredibly useful, it’s often beneficial to combine it with other types of data (e.g., candlestick charts, news feeds) to get a more comprehensive view of the market.

Watch 3 days Demo Installation to feed tick data to Amibroker

Next, watch tutorial videos that demonstrate how to set up and configure the free trial of the Amibroker data feed Many providers have video guides, walking you through the process.

Conclusion

Tick data is a powerful tool that can give traders a significant edge in the markets. When used in conjunction with a robust platform like AmiBroker, it opens up a world of possibilities for strategy development, backtesting, and real-time decision-making. Whether you’re a day trader, scalper, or high-frequency trader, incorporating tick data into your trading routine can help you make smarter, more informed decisions and ultimately improve your trading performance.

So, if you’re not already using tick data in AmiBroker, now is the time to start. With the right approach and tools, you can unlock the full potential of tick data and take your trading to the next level. Happy trading!

20 Years Amibroker Historical Data Download

Ultimate Guide: 20 Years Amibroker Historical Data Download

Looking to supercharge your trading analysis with comprehensive amibroker historical data? The ability to download 20 years of NSE EOD data for Amibroker is a game-changer for serious traders and analysts. Whether you’re developing trading strategies, conducting technical analysis, or diving into algorithmic trading, having access to extensive historical data is crucial for making informed decisions.

Key Takeaways

  • Complete walkthrough for downloading and integrating extensive NSE amibroker historical data into Amibroker for technical analysis and algorithmic trading
  • Essential setup requirements for Amibroker’s real-time data feed and configuration steps for seamless implementation
  • Practical applications focusing on strategy backtesting, portfolio management, and making correct trading decisions
  • Detailed information about data feeder software, including AmiBroker data feed and tickbytick software integration
  • Guidelines for accessing live data feeds and EOD data for both equity and future markets

Understanding EOD Data and Its Importance

End of Day (EOD) data represents a comprehensive collection of trading information from the National Stock Exchange after market hours. This data serves as a crucial resource for traders, investors, and analysts who rely on historical market information for their decision-making processes.

What is NSE EOD Data?

NSE EOD data includes vital trading metrics like opening price, closing price, high, low, and trading volume for all listed securities. This information is recorded at the end of each trading day, providing a snapshot of market activity. The data helps traders understand price movements, market trends, and trading patterns over extended periods.

Significance in Market Analysis

Amibroker historical data spanning 20 years offers invaluable insights into long-term market behavior. It enables traders to identify cyclical patterns, seasonal trends, and market anomalies that might not be apparent in shorter timeframes. This extensive dataset helps in developing robust trading strategies and making informed investment decisions.

Benefits for Trading Systems

Access to two decades of market data proves instrumental in building and testing trading systems. It allows traders to:

– Validate trading strategies across different market conditions

– Analyze market behavior during various economic cycles

– Identify recurring patterns and trends

– Test system performance during bull and bear markets

– Optimize trading parameters for better results

Role in Risk Management

Long-term amibroker historical data plays a crucial role in risk assessment and management. It helps traders understand:

– Maximum drawdown scenarios

– Volatility patterns during market stress

– Correlation between different market segments

– Historical risk-reward ratios

– Market behavior during extreme events

Setting Up Amibroker Historical Data

Software Requirements

Before diving into historical data analysis, you need to set up two essential components. First, install Amibroker, a powerful technical analysis software. Second, get AmiProfits Feeder, a specialized tool for downloading NSE EOD data. These tools work together seamlessly to provide comprehensive market analysis capabilities.

Make sure your system meets the minimum requirements for smooth operation. A stable internet connection is crucial for consistent data downloads. Additionally, ensure you have sufficient storage space to accommodate 20 years of amibroker historical data.

Configuration Process

Start by launching Amibroker and navigating to the File > Database Settings menu. Here, you’ll need to create a new database specifically for NSE data. Select an appropriate location on your hard drive with ample space.

Next, configure AmiProfits Feeder by entering your login credentials and selecting your preferred data package. Connect it to your Amibroker database by specifying the correct database path. This ensures seamless data integration between both platforms.

In the AmiProfits Feeder settings, choose your desired timeframe for historical data download. You can select specific date ranges or opt for the complete 20-year dataset.

Remember to set up automatic daily updates to keep your database current. This ensures you always have the latest market data for analysis. Regular maintenance checks help identify and resolve any data gaps or inconsistencies.

Real-Time Data Integration

The integration of real-time data with Amibroker transforms it into a powerful live trading platform. This seamless connection ensures you’re always trading with the most current market information, essential for making informed decisions.

Setting Up Real-Time Feed

AmiProfits Feeder acts as the bridge between live market data and Amibroker. The setup process involves configuring your data feed parameters and ensuring proper connectivity. Once established, you’ll receive continuous price updates, volume data, and market depth information directly in your Amibroker platform.

Live Market Monitoring

With real-time integration, you can monitor market movements as they happen. The system updates charts, indicators, and trading signals instantly, allowing you to spot opportunities and react to market changes immediately. This live monitoring capability is crucial for day traders and short-term investors who need to make quick decisions.

Automated Trading Execution

Real-time data integration enables automated trading systems to execute orders based on predefined conditions. When your trading strategies detect specific patterns or indicator signals, they can automatically place orders through your connected trading platform. This automation eliminates emotional decision-making and ensures consistent strategy implementation.

Data Quality Assurance

The system performs continuous checks to maintain data accuracy and reliability. It automatically validates incoming data against multiple parameters to prevent errors or gaps in your trading analysis. Regular data verification ensures that your trading decisions are based on accurate, up-to-the-minute market information.

Advanced Analysis Capabilities

The integration of 20 years of NSE EOD data into Amibroker opens up powerful analytical possibilities that can transform your trading approach. This comprehensive dataset serves as the foundation for sophisticated market analysis and strategy development.

Technical Analysis Tools

Amibroker’s advanced charting capabilities allow you to visualize long-term market trends with precision. You can apply multiple technical indicators simultaneously, from simple moving averages to complex oscillators, across extended timeframes. The platform enables pattern recognition across decades of market data, helping identify recurring market behaviors and potential trading opportunities.

The ability to analyze historical price movements across different market cycles provides invaluable insights into market behavior. You can study how specific patterns have performed during various economic conditions, from bull markets to bear markets, and everything in between.

Strategy Development and Optimization

With access to 20 years of market data, you can develop and refine trading strategies with unprecedented accuracy. Amibroker Formula Language (AFL) allows you to code custom indicators and trading systems, testing them against extensive historical data to ensure reliability.

Amibroker’s optimization engine helps fine-tune strategy parameters using two decades of market data. This extensive testing period helps avoid curve-fitting and ensures your strategies are robust across different market conditions. You can backtest multiple variations of your trading systems, analyzing their performance through various market cycles to identify the most consistent approaches.

The platform’s walk-forward analysis capabilities let you validate your strategies using out-of-sample data, providing a realistic assessment of how they might perform in live trading conditions. This comprehensive testing approach helps build confidence in your trading systems before deploying them in real markets.

Risk Considerations and Support

Data Reliability Concerns

When working with Amibroker historical data , it’s crucial to understand potential data quality issues. Market data can sometimes contain gaps, adjustments for corporate actions, or occasional errors. Regular verification of data accuracy through cross-referencing with official sources helps maintain reliable analysis results.

Technical Requirements

Your system should meet specific hardware requirements to handle large datasets spanning 20 years. A minimum of 8GB RAM and sufficient storage space is necessary for smooth operation. Stable internet connectivity is essential for consistent data updates and backfilling processes.

Available Support Channels

Multiple support options are available for users implementing NSE EOD data in Amibroker. These include:

– Official documentation and user guides

– Anydesk support 24/7

– whatsapp support for technical queries

– Video tutorials for step-by-step guidance

Conclusion

Accessing 20 years of NSE EOD data for Amibroker is a powerful tool that can revolutionize your trading journey. With comprehensive historical data at your fingertips, you’re equipped to make more informed trading decisions through robust backtesting and technical analysis.Your journey to more informed and data-driven trading decisions begins here.

FAQs

Is historical data in Amibroker suitable for both intraday and positional trading analysis?

Historical data in Amibroker is ideal for both trading styles. For intraday trading, you can analyze minute-by-minute patterns, while for positional trading, EOD data helps identify long-term trends. The technical analysis platform offers versatile timeframe options to suit different trading strategies.

How often is the historical data updated in Amibroker?

The EOD data is updated daily after market hours, typically within 30 minutes of market closing. For real-time traders, live data feed updates occur instantly through the data feeder app, ensuring accurate and timely information for making correct trading decisions.

Can I export Amibroker historical data to other trading platforms?

Yes, Amibroker supports data export in various formats, including MetaStock data format. This flexibility allows active traders to use the historical data across different algorithmic trading platforms while maintaining data integrity and accuracy.

What happens to my historical data if I change my subscription plan?

Your downloaded historical data remains intact even if you change or pause your subscription. However, you’ll need an active subscription to receive new updates and live data feed. The existing data stays in your local database for continued analysis.

Is the historical data adjusted for corporate actions like splits and bonuses?

Yes, the NSE EOD data is fully adjusted for corporate actions including stock splits, bonuses, and dividends. This ensures accurate backtesting results and reliable technical analysis for stock market traders using the platform.

How much storage space is required for 20 years of historical data?

The storage requirement for 20 years of NSE EOD data is approximately 5-7 GB, depending on the number of symbols and data points. It’s recommended to have at least 10 GB of free space for smooth operation of the Amibroker software with historical data.

best amibroker data feed provider

How to Choose the Best Amibroker Data Feed Provider in 2025: Expert Guide [Step-by-Step]

Supercharge your trading game with best amibroker data feeds in 2025? The right data feed provider is crucial for successful trading – it’s the foundation that powers your market analysis, backtesting, and real-time trading decisions. But with numerous options available, choosing the perfect provider can feel overwhelming. In this comprehensive guide, we’ll walk you through the essential steps to select the best Amibroker data feed provider

Understanding Amibroker Data Feeds

A data feed serves as the lifeline of your Amibroker trading system, providing essential market information in real-time or end-of-day format. It’s crucial to understand how these feeds work to make informed trading decisions.

What is an Amibroker Data Feed?

An Amibroker data feed is a continuous stream of market data that flows into your Amibroker software. This data includes crucial information like price movements, trading volumes, and other market indicators that help you analyze market trends and execute trades effectively.

Types of Data Feeds

Real-time feeds deliver instant market updates, making them ideal for day traders and scalpers who need up-to-the-second information. These feeds provide immediate access to price changes, allowing quick response to market movements.

Historical data feeds, on the other hand, offer end-of-day data perfect for swing traders and long-term investors. They’re essential for backtesting trading strategies and conducting thorough market analysis.

Components of Data Feed

A comprehensive data feed includes several key elements:

– Price data (open, high, low, close)

– Trading volume information

– Market depth details

– Technical indicators

– Corporate actions data

Quality Factors

The reliability of your trading decisions depends heavily on data quality. Key aspects include:

– Data accuracy and consistency

– Low latency in data delivery

– Comprehensive market coverage

– Regular updates and maintenance

– Historical data availability

Types of Data Feed Providers

  • Real-Time Data Feed Providers

    Real-time data feed providers deliver instantaneous market information directly to your Amibroker platform. These providers maintain dedicated servers and infrastructure to ensure minimal latency in data transmission. They offer comprehensive coverage of various markets, including stocks, futures, options, and forex. ( Amiprofits provides tick data and 5 days demo available )

    – Sub-second data updates

    Level 1 and Level 2 market depth

    – Corporate actions and announcements

    – Technical support and documentation

    – Custom data filtering options

    While real-time feeds come with higher subscription costs, they are essential for day traders and scalpers who need immediate market information for quick decision-making.

    amiprofits amibroker data feed price is very less compared to everyone with top quality data

    Historical Data Feed Providers

    Historical data providers focus on delivering end of day (EOD data) and historical market data for analysis and backtesting purposes. These providers maintain extensive databases of historical price and volume information, often spanning several decades.

    What to see ?

    – Clean and adjusted historical data

    – Fundamental company information

    – Dividend and split history

    – Delisted securities data

    – Bulk data download capabilities

    Historical data feeds are particularly valuable for:

    – Developing and testing trading strategies

    – Conducting thorough market research

    – Analyzing long-term market trends

    – Building robust trading systems

    Get Last 20 years Amibroker EOD data within minutes with Amiprofits

    While historical feeds update less frequently than real-time feeds, they typically offer more comprehensive historical coverage and are more affordable, making them ideal for swing traders and position traders.

Essential Features to Consider

When evaluating best amibroker data feed providers, several crucial features demand your attention to ensure optimal trading performance.

Data Accuracy and Reliability

Accuracy in financial data is non-negotiable for successful trading. Look for providers offering verified, high-quality data streams with minimal errors or gaps. The data should be consistently reliable, with robust error-checking mechanisms in place to maintain data integrity.

Real-time Updates

The speed of data delivery can significantly impact your trading decisions. Premium providers typically offer data updates with minimal latency, often within milliseconds. This rapid update capability is especially crucial for day traders and algorithmic trading systems.

Market Coverage

Comprehensive market coverage across different exchanges and asset classes is vital. Ensure your chosen provider offers data for all the markets you plan to trade. This includes coverage of stocks, indices, futures, options, and international markets if required for your trading strategy.

Historical Data Access

Access to quality historical data is essential for backtesting and strategy development. Look for providers offering extensive historical databases with clean, adjusted data accounting for corporate actions like splits and dividends. The depth of historical data should match your analytical needs.

Technical Support

Professional technical support can be invaluable when dealing with data feed issues. Evaluate the provider’s support infrastructure, including response times, availability hours, and troubleshooting expertise. Good support can minimize trading disruptions caused by technical problems.

Integration Capabilities

The data feed should seamlessly integrate with Amibroker without requiring complex setup procedures. Check for compatibility with your specific version of Amibroker and any additional tools or plugins you use in your trading workflow.

Data Quality and Reliability Factors

Data quality and reliability are crucial factors that can make or break your trading success. Let’s explore the key aspects that determine the effectiveness of your Amibroker data feed.

Accuracy and Precision

High-quality data feeds ensure precise price points, accurate volume data, and correct market indicators. Even minor discrepancies can lead to significant trading losses. Premium providers typically maintain rigorous quality control measures to deliver accurate market information.

Timeliness and Latency

In the fast-paced trading environment, speed matters. Real-time data feeds should deliver information with minimal delay. Lower latency means you can execute trades more effectively, especially during volatile market conditions.

Data Consistency

Your feed should maintain consistent data delivery without gaps or missing information. Look for providers that offer comprehensive historical data alongside real-time updates. This consistency is essential for reliable backtesting and strategy development.

Error Handling

Quality data feeds implement robust error detection and correction mechanisms. They should automatically identify and fix data anomalies, preventing incorrect trading signals. The system should also notify you of any significant data issues.

Market Coverage

Reliable data feeds offer extensive market coverage across different segments. Whether you trade stocks, futures, or forex, ensure your provider delivers complete data for your preferred markets without frequent outages or gaps.

Technical Support

Consider providers offering 24/7 technical support to address data-related issues promptly. Quick resolution of technical problems helps maintain uninterrupted trading operations and minimizes potential losses.

Setting Up Your Best Amibroker Data Feed

Installation Process

Setting up the best amibroker data feed requires careful attention to detail. First, download the data feed software from your chosen provider’s official website. Most providers offer dedicated installation packages that streamline the setup process. Run the installer and follow the on-screen prompts to complete the basic installation.

During installation, you’ll need to input your login credentials provided by the data feed service. Make sure to store these credentials securely as you’ll need them for future access. The installation wizard typically handles all necessary driver installations and initial configurations automatically.

Configuration Steps

Conclusion

Selecting the best amibroker data feed provider is a critical decision that can significantly impact your trading success. By following this comprehensive guide and considering factors like data quality, real-time capabilities, market coverage, and cost-effectiveness, you’re now equipped to make an informed choice that aligns with your trading style and objectives. Remember,

the perfect data feed provider isn’t just about the lowest price or the most features – it’s about finding the right balance that supports your specific trading strategy. Whether you opt for a premium service with advanced capabilities or start with a reliable free alternative, ensure your chosen provider delivers accurate, timely data that integrates seamlessly with your Amibroker environment.

Take action today by evaluating your current trading needs, comparing providers using our outlined criteria, and making the switch to a data feed service that will elevate your trading performance. Your journey to more informed, data-driven trading decisions starts with this crucial step.

latency in amibroker

The Role of Latency in Amibroker Data Feed and How to Reduce It

Latency in Amibroker data feed refers to the delay between a market event such as a stock price going up or down, a new trade being executed, or a change in volume and that event being reflected in your Amibroker charting software. 

Let’s discuss the role of latency in the Amibroker Data feed and how to reduce it easily.

What is Latency in Amibroker Data Feed?

“Simply said, Latency means it is the time gap between when something happens in the market and when you see it reflected in your Amibroker charts.”

This delay or time gap can be caused by various factors, including 

  • Network Congestion – Like traffic on a highway, if the internet connection is busy (lots of people using it at the same time), data takes longer to travel from the data source to your computer.
  • Server Load – The servers that provide the market data have to handle many requests from users. If they are overloaded, they can’t send data out quickly to everyone.

Amibroker Data Feed Provider‘s Infrastructure – The quality of the data provider’s equipment and network directly impacts how fast they can deliver data. A better infrastructure means lower latency.

How does latency in Amibroker Data Feed impact trading decisions in Amibroker?

  • Inaccurate Trading Signals

Trading signals are indicators generated by your charting software (Amibroker) that suggest when to buy or sell an asset. These signals are based on real-time market data.

If there is a high latency, the data your Amibroker software receives is old. This means the signals it generates might be based on outdated information, leading to bad trading decisions.

You might miss profitable opportunities because the signal to buy came late after the price has already gone up.

Or you might enter trades at unfavorable prices because the signal to sell came late after the price had already gone down.

  • Slippage

Slippage happens when the price you expect to buy or sell at is different from the price at which your order is actually executed.

In fast-moving markets (where prices change rapidly), even a small delay (latency) can cause significant slippage.

For example, you might want to buy a stock at Rs 1000, but due to latency, your order is executed at Rs 1000.50. That Rs 0.50 difference is slippage, and it eats into your profits.

  • Backtesting Inaccuracy

It is like watching a recording of the game that is slightly out of sync. You might think you timed a jump perfectly, but in reality, you were off.

When you backtest a trading strategy, you are essentially testing it on historical data to see how it would have performed in the past. This helps you get an idea of its potential profitability and risk. 

However, if the historical data you’re using has latency issues, it can lead to inaccurate backtesting results.

Latency in historical data refers to delays or gaps in the data. For example, if the data doesn’t accurately reflect the exact time when trades were executed or if there are missing data points, it can skew your backtesting results. This is because your strategy might make trading decisions based on outdated or incomplete information, leading to unrealistic outcomes.

Importance of Low Latency

Let’s break down the importance of low latency (speed of data delivery) in trading, especially within a platform like Amibroker. 

Imagine latency as the delay between when something happens in the real world (like a stock price change) and when you see that change on your screen.

  • Timeliness of Data (Low Latency = Good)

Think of it like this: if you are trying to catch a ball, you need to see where it is now, not where it was a second ago. In trading, if you are getting data with high latency (a significant delay), you’re essentially seeing where the market was, not where it is. This can lead to bad decisions.

  • Low Latency (Fast) – You see the ball (market data) almost instantly, allowing you to react quickly and make informed decisions.
  • High Latency (Slow) –  You see the ball with a delay. By the time you react, the ball has already moved, causing you to miss it (miss an opportunity or make a bad trade).
  • Accuracy of Trading Signals (Low Latency = Crucial for Automated Systems) 

Many traders use computer programs (algorithms) to automatically buy and sell based on specific market conditions. These programs need up-to-the-second data to work correctly.

  • Imagine a program designed to buy a stock the instant its price goes above $10. If the data is delayed (high latency), the program might buy the stock after it has already gone up to $10.10, meaning you’ve paid more than you intended. 
  • Or, it might not buy at all if the price quickly jumped to $10.10 and then back down below $10 before the program saw the initial $10 price.
  • User Experience (Low Latency = Smoother and More Effective)

In a trading platform like Amibroker, low latency makes everything feel more responsive. Charts update smoothly, orders execute quickly, and the whole experience is more efficient.

In short: Low latency is essential for successful trading, especially when using automated systems or fast-paced strategies. It ensures you are making decisions based on the most current information, leading to better outcomes and a smoother trading experience. High latency, on the other hand, can lead to missed opportunities, inaccurate trades, and a frustrating user experience.

What are the best practices to minimize latency in Amibroker data feed?

  • Choose a Reliable Data Provider (The Source Matters)

Your data feed is the source of the market information. If the source is slow, everything downstream will be slow too.

  • Good Data Provider  – Think of this as a high-speed internet connection. Data arrives quickly and consistently. Amiprofits provides Amibroker data feed with ZERO DELAY, which is excellent.
  • Optimize Data Update Settings (Control How Amibroker Gets Data)

Amibroker has settings that control how often it checks for new data. Adjusting these can help.

  • Scheduling Updates – Imagine checking your email every 5 minutes versus constantly refreshing it. Scheduling updates (e.g., during less busy market times) reduces the load on your system during critical trading hours.
  • Batch Updates – Instead of getting every single price change individually, Amibroker can gather changes in batches. This is like receiving a summary of the news instead of constant notifications, reducing the processing load.
  • Hardware and Network Optimization (Faster Computer, Faster Internet)

Your computer and internet connection plays a big role.

  • Better Hardware – A more powerful computer (faster processor, more RAM) can handle data processing more efficiently, reducing delays.
  • Better Network – A faster internet connection (higher bandwidth) allows data to travel to your computer more quickly. 
  • Limit Background Processes (Don’t Overload Your Computer) – Running many programs at once slows down your computer.
  • Close Unnecessary Programs – When trading, close programs you don’t need (like web browsers, games, etc.). This frees up your computer’s resources to focus on Amibroker and processing market data.
  • Regularly Monitor Performance (Keep an Eye on Things)

It is important to monitor how well your system is performing.

  • Track Latency – Amibroker and some data providers offer tools to measure latency. Regularly checking these metrics helps you identify problems early. 

By following these tips, you can ensure that you are working with the most up-to-date information, leading to better trading decisions.

  • Can Latency Issues Be Resolved By Using A Different Data Feed Provider?

    Yes, latency issues can often be resolved by switching to a different Amibroker data feed provider. Many providers offer varying levels of speed and reliability, so selecting a provider known for low latency can significantly improve data update times in Amibroker, leading to more timely trading decisions.

    Are There Specific Amibroker Data Feed Providers That Offer Lower Latency For Amibroker?

    Yes, several specific data feed providers are recognized for offering lower latency for Amibroker. One of the leading Amibroker data feed providers is Amiprofits. Amiprofits is Known for its fast data updates and ZERO DELAYS, making it suitable for traders requiring real-time information. We offer tick-by-tick real-time updates and provide low latency with historical backfill options for up to 365 days.

    Final Thoughts

    Latency is about how quickly you see market changes on your Amibroker charts. It’s like watching a sports game with a delay – you might miss important plays. This can lead to bad trading decisions, like buying too late or selling too early. To fix this, use a reliable Amibroker data feed provider like Amiprofits, tweak Amibroker settings, and make sure your computer is speedy. This way, you will see market changes right away and make smarter trades.

difference between realtime data vs eod data

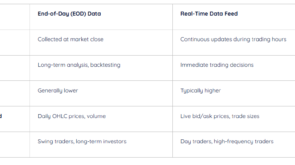
What is the Difference between End-of-Day (EOD) vs Real-Time Amibroker Data Feed?

Amibroker is a popular software that traders use for charting, technical analysis, backtesting trading strategies, and automated trading. It needs two types of Amibroker data feed to function.

What is Amibroker Data Feed End-of-Day (EOD) and Real-time (RT)?

End-of-Day (EOD) Data

  • EOD data is updated once per day, usually after the market closes.
  • It typically includes the Open, High, Low, and Close prices for the day, along with the trading volume.
  • Think of it like a daily summary of the market’s activity.

Real-Time Live Amibroker Data

  • This data is updated continuously throughout the trading day.
  • It provides a constant stream of price and volume information, allowing traders to see price changes as they happen.
  • This is like watching a live video of the market’s activity.

Why Choosing between EOD and Real-time Data is crucial?

The type of Amibroker data feed you need (EOD or real-time) depends on your trading style

  • EOD Data – It is suitable for long-term investors or swing traders who make decisions based on daily or weekly price movements. They analyze trends over days, weeks, or months.
  • Real-Time Data – It is essential for day traders or scalpers who make multiple trades within a single day, capitalizing on short-term price fluctuations. They need to see price changes as they occur to react quickly.

What is the Purpose of the EOD Data and Real-time Data in Amibroker Data Feed?

End of Day (EOD)

EOD data is collected and provided at the end of the trading day. This data includes key metrics such as

  1. Opening Price – The price at which the first trade of the day occurred.
  2. Closing Price – The price at which the last trade of the day occurred.
  3. Highest Price (High) – The highest price reached during the trading day.
  4. Lowest Price (Low) – The lowest price reached during the trading day.
  5. Volume Traded – The total number of shares or contracts traded during the day.

Why it is used?

  • Long-Term Analysis – EOD data is primarily used for analyzing market trends over longer timeframes (days, weeks, months, or even years). It helps traders identify long-term patterns, support and resistance levels, and overall market direction.
  • Not for Immediate Trading – Because it is only updated once per day, EOD data is not suitable for making immediate trading decisions based on current market fluctuations. It does not show intraday price movements.
  • Backtesting Trading Strategies – EOD data is crucial for backtesting. This involves testing a trading strategy on historical data to see how it would have performed in the past. This helps traders evaluate the potential effectiveness of their strategies before risking real capital.
  • Technical Analysis – EOD data is the foundation for many technical analysis techniques. Traders use it to create charts and identify patterns like trendlines, chart formations (e.g., head and shoulders, flags, pennants), and indicators (e.g., moving averages, RSI, MACD).

Real-time data (RT)

Real-time data feeds in Amibroker provides

  • Instantaneous Updates. Unlike EOD data, Real-time feeds deliver live market information with minimal delay, which is essential during volatile market conditions.” This is the core advantage of real-time data. The data is streamed continuously, providing near-instantaneous updates on price changes, volume, and other market activity. This is particularly crucial during periods of high volatility, where prices can fluctuate rapidly. In such conditions, even small delays in data delivery can lead to missed opportunities or significant losses.
  • Responding Quickly: This constant stream of data allows traders to see market changes as they happen and react to them immediately. This is essential for strategies that rely on capturing very short-term price movements.

Why it is vital for certain trading strategies?

  • High-Frequency Trading (HFT) – This involves using powerful computers and complex algorithms to execute a high volume of trades in extremely short timeframes (milliseconds or even microseconds). Real-time data with very low latency is absolutely essential for HFT, as even tiny delays can result in missed opportunities or losses.
  • Day Trading – Day traders open and close positions within the same trading day, aiming to profit from intraday price fluctuations. Real-time data is crucial for day traders to
    • Identify entry and exit points based on current price action.
    • Monitor open positions and manage risk.
    • React quickly to sudden market moves.
  • Timing is Critical – Both HFT and day trading rely heavily on precise timing. Real-time data provides the necessary information to make split-second decisions and execute trades at the optimal moment.
  • Comprehensive Data – Real-time feeds include detailed information such as bid/ask prices, trade sizes, and other metrics that can influence immediate trading decisions. 

Unlike EOD data, which typically only includes OHLC (Open, High, Low, Close) and volume, real-time feeds provide a much richer dataset. This includes

  • Bid/Ask Prices – The bid price is the highest price a buyer is willing to pay, while the ask price is the lowest price a seller is willing to accept. These prices are crucial for understanding the market depth and liquidity.
  • Trade Sizes – The number of shares or contracts traded in each transaction. This information can provide insights into market sentiment and buying/selling pressure.
  • Other Metrics – Depending on the data provider, real-time feeds may also include other valuable information such as time stamps, order book data, and market depth information.

These characteristics make real-time data essential for traders who require speed, precision, and detailed market information, such as day traders, scalpers, and high-frequency traders.

Comparison Table of EOD and RT Amibroker Data Feed


Feature

End-of-Day (EOD) Data

Real-Time Data Feed

Timing

Collected at market close

Continuous updates during trading hours

Usage

Long-term analysis, backtesting

Immediate trading decisions

Cost

Generally lower

Typically higher

Data Provided

Daily OHLC prices, volume

Live bid/ask prices, trade sizes

Ideal For

Swing traders, long-term investors

Day traders, high-frequency traders

Final Thoughts

Choosing between EOD and real-time Amibroker data feed depends on a trader’s specific needs and strategies. EOD data is suited for those focusing on longer-term trends and historical analysis.  So, if you are a long-term investor, paying for expensive real-time data is unnecessary. Real-time data is essential for those engaged in immediate trading activities that require swift decision-making. If you are a day trader, relying on EOD data would be like trying to drive a race car while only getting updates on your speed once per hour, you would crash. So, if you understand these differences, you can significantly impact trading performance and strategy development.

Looking for the best provider of both EOD and RT data at affordable prices, check out Amiprofits today.

mt4 data feed and xmaster formula mt4 indicator

Xmaster Formula MT4 Indicator Free Download 2024

Introduction: Boost Your Trading with the Xmaster Formula MT4 Indicator

In the ever-evolving world of forex trading, having reliable tools to guide your decisions is crucial. The Xmaster Formula MT4 Indicator offers an advanced, yet easy-to-use solution for identifying trends, buy/sell signals, and potential market reversals. Combining the power of technical indicators like Moving Averages, RSI, MACD, and Bollinger Bands, this tool is a game-changer for both beginner and advanced traders. In this article, we’ll dive into the features and practical applications of the Xmaster Formula MT4 Indicator and explore how it can enhance your trading strategy in 2024.

xmaster formula mt4 indicator

What is the Xmaster Formula MT4 Indicator?

This MT4 Indicator is designed to help forex traders pinpoint key support and resistance levels, potential price reversals, and optimal entry/exit points. By integrating multiple indicators like Moving Averages, RSI, MACD, and Bollinger Bands, it provides precise signals that can aid in making informed trading decisions.

Key Features:

  • BUY/SELL Signals: Arrows on the chart indicate potential buy and sell opportunities.
  • Trend Confirmation: Uses color-coded signals to confirm bullish (green) and bearish (red) trends.
  • No-Repaint Algorithm: Once a signal appears, it stays, ensuring reliable data.
  • Compatible with MT4 and MT5: The Xmaster Formula MT4 Indicator works seamlessly with both platforms, with the latest version offering enhanced features.
xmaster formula mt4 indicator 2024

How Does the Xmaster Formula MT4 Indicator Work?

  • This works by processing data from key technical indicators and outputting clear signals. When you see a yellow arrow pointing upwards, it signals a potential buy entry, while a downward yellow arrow suggests a sell signal. These signals are further validated by lime-colored dots (for bullish trends) and red-colored dots (for bearish trends).

    Practical Application:

    • Buy Signal: Enter a buy trade when the yellow up arrow appears, confirmed by lime-colored dots.
    • Sell Signal: Enter a sell trade when the yellow down arrow appears, confirmed by red-colored dots.
    • Exit Strategy: Close the trade when the opposite arrow appears, signaling a trend reversal.

    By integrating the MT4 data feed, the Xmaster Formula MT4 Indicator ensures that traders have access to real-time, accurate market data for effective decision-making.

Using the Xmaster Formula MT4 Indicator: A Step-by-Step Guide

  • 1. Installation in MT4

    To begin using the Xmaster Formula MT4 Indicator, download the indicator file and install it in the Indicators folder of your MT4 platform. Restart MT4 and refresh the Navigator section to access the indicator.

    2. How to Trade Using the Xmaster Formula MT4 Indicator

    • Buy Strategy: Enter a buy position when two consecutive green arrows appear, indicating an uptrend. Place your stop loss at the previous swing low.
    • Sell Strategy: Enter a sell position when two consecutive red arrows appear, signaling a downtrend. Place your stop loss at the previous swing high.

    3. Confirmation and Exit

    To enhance accuracy, always confirm the signals with other technical indicators like support/resistance levels or candlestick patterns. Exit the trade when the opposite signal appears.

Advantages of the Xmaster Formula MT4 Indicator

This is highly versatile and offers several benefits for forex traders:

  • Works Across All Timeframes: Whether you’re a scalper or a long-term trader, this can be applied to any timeframe.
  • Multi-Currency Pair Compatibility: Use it across all currency pairs, including majors, minors, and exotics.
  • User-Friendly Interface: The indicator’s clear signals make it accessible to both novice and experienced traders.
  • Customizable: Adjust the indicator settings to suit your personal trading strategy.

Disadvantages of the Xmaster Formula MT4 Indicator

While it have many advantages, it does come with a few drawbacks:

  • Lagging Signals: Like many trend-following indicators, the Xmaster Formula MT4 Indicator may lag during fast-moving trends, resulting in delayed entry signals.
  • False Signals in Low Volatility Markets: The indicator might generate false signals during sideways or low volatility conditions, leading to potential losses.
  • Risk of Missed Opportunities: Due to its lagging nature, the indicator may sometimes miss the best entry points.

Xmaster Formula MT4 Indicator Trading Strategy Examples

Long Position Strategy:

  1. When this MT4 Indicator shows two consecutive upward arrows (green), it signals sustained upward momentum.
  2. Enter a buy trade when the second green arrow appears.
  3. Set your stop loss below the recent swing low and exit when the opposite sell signal (red arrow) appears.

Short Position Strategy:

  1. When the Xmaster Formula MT4 Indicator shows two consecutive downward arrows (red), it indicates a potential downtrend.
  2. Enter a sell trade when the second red arrow appears.
  3. Set your stop loss above the recent swing high and exit when the opposite buy signal (green arrow) appears.

Real-World Example of Using the Xmaster Formula MT4 Indicator

Here’s a practical example of how to use the Xmaster Formula MT4 Indicator in a trading scenario:

  • Long Position Example: When the Xmaster Formula MT4 Indicator prints two green arrows on a 15-minute chart for EUR/USD, it suggests the market is trending upwards. Enter a buy position at the opening of the next candle and place your stop loss below the previous swing low.

  • Short Position Example: When the indicator prints two red arrows, indicating a downtrend, enter a sell position with a stop loss above the previous swing high.

Xmaster formula indicator mt4 download : How to Download Instanly ?

If you’re ready to download the XMaster Formula MT4 Indicator for your MetaTrader 4 platform, getting started is simple and quick. To ensure you receive the most up-to-date and secure version of the indicator, we recommend chatting directly with our support team.

Why Chat with Support?

  • Instant Response: Our support team is available 24/7 to provide you with a direct download link, ensuring you can start using the XMaster Formula Indicator without delay.
  • Verified Link: By contacting support, you’ll receive a verified and safe download link, reducing the risk of downloading a corrupted or outdated file.
  • Installation Assistance: If you encounter any issues during the download or installation process, our support team can guide you step-by-step, ensuring a smooth setup.

How to Contact Support:

  1. Click on the chat icon located at the bottom right corner of our website.
  2. Ask for the download link for the XMaster Formula Indicator MT4.
  3. Follow the instructions provided by the support team to download and install the indicator.

With instant support, you can start using the XMaster Formula MT4 Indicator on your MT4 platform quickly, enhancing your trading strategy with this powerful tool.

Can the Xmaster Formula MT4 Indicator be used on MT5?

Yes, the Xmaster Formula MT4 Indicator is compatible with both MT4 and MT5 platforms. However, MT5 offers enhanced features and is recommended for advanced traders.

Is the Xmaster Formula MT4 Indicator free?

Yes, the indicator is free to download and use on the MT4 platform.


Can I customize the settings on the Xmaster Formula MT4 Indicator?

Yes, the indicator is fully customizable, allowing traders to adjust parameters like colors, alerts, and styles to suit their preferences.

Does the Xmaster Formula MT4 Indicator repaint?

No, the Xmaster Formula MT4 Indicator does not repaint. Once a signal is generated, it remains fixed on the chart, giving traders confidence that the signal is accurate and not subject to change as new data comes in.

Can I use the Xmaster Formula MT4 Indicator for scalping?

Yes, the Xmaster Formula MT4 Indicator can be used for scalping, as it works on all timeframes, including lower ones like the 1-minute and 5-minute charts. However, as with any strategy, it is essential to confirm signals with other indicators or price action before entering a trade.

Is the Xmaster Formula MT4 Indicator suitable for beginners?

Yes, the Xmaster Formula MT4 Indicator is beginner-friendly, thanks to its clear and easy-to-understand signals (such as arrows and trend confirmations). However, it is still recommended for beginners to combine it with other fundamental and technical analysis tools for more robust trading decisions.

Conclusion

The Xmaster Formula MT4 Indicator is a powerful and versatile tool for forex traders looking to enhance their strategies with clear, actionable signals. Whether you’re a beginner or a seasoned professional, this trend-following indicator simplifies the process of identifying buy and sell signals. By integrating it with your MT4 data feed, you can maximize the potential of your forex trades. Remember to combine it with other technical analysis tools to confirm your signals and manage risk effectively.

amibroker data feed free

3 Steps to Get Amibroker Data Feed Free For Five Days

Amibroker is one of the most popular stock analysis and algorithmic trading platforms used by active traders in India. However, one challenge traders face is getting reliable and accurate data feeds for free. Thankfully, there is now an easy way to feed free data into Amibroker – with free access for five days, allowing traders to test the service before committing to it.

What is Amibroker Data Feed Free?

An Amibroker data feed free for five days allows you to automatically download real-time or historical price data for stocks trading on various exchanges directly into the Amibroker software – free of charge for the first five days. This free trial period enables Amibroker users to backtest trading strategies and build stock screening formulas using reliable, high-quality data feed without any cost.

After the free trial, you can choose whether or not to continue using the service for a paid plan, depending on how well the data feed integrates with your strategies and workflow.

Why Amibroker Data Feed Free is Needed?

Here are several key reasons why using a free data feed with five-day access for Amibroker is highly beneficial:

  • Test Before Commitment: The five-day trial gives you enough time to test the service and see if it meets your needs without paying upfront.
  • Accurate Data: Many data providers offer accurate and reliable information, making them dependable for analysis.
  • Saves Time: Automatically gets the required data without any manual effort.
  • Backtesting Dependability: With five days of free access, you can backtest some strategies to evaluate the quality and reliability of the data.
  • Seamless Data Integration: Free trials often include full integration capabilities with Amibroker databases, so you can see exactly how the data works with your existing setups.
  • Always Up-To-Date: During the free period, the data is regularly updated, ensuring you get the latest market information.

As you can see, the five-day free trial for the data feed allows you to assess whether the tool fits your trading strategy without the need for immediate financial commitment.

How to Get Amibroker Data Feed Free for Five Days

If you want an easy way to automatically download data into Amibroker for free, follow these simple steps:

Step 1: Download Amibroker and Sign Up for Free Trial

First, download Amibroker from the official website. Then, sign up for the free five-day data feed trial from a trusted data provider that integrates with Amibroker. Many providers offer this option, allowing you to explore their data feed quality.

Step 2: Watch Tutorial Videos for Installation

Next, watch tutorial videos that demonstrate how to set up and configure the free trial of the data feed with Amibroker. Many providers have video guides, walking you through the process.

Step 3: Select Stocks & Configure Data Feed

Once Amibroker and the data feed are set up, select the list of stocks or markets you want the data for. Then configure the free trial to automatically pull the real-time or historical data into Amibroker during the five-day period.

Step 4: Backfill Historical Data

Within Amibroker, you can use the free data feed to backfill historical data for the stocks you’ve selected. This will help you assess the depth and quality of historical data during the free trial.

After these simple steps, you will have free access to high-quality data inside your Amibroker software for five days. You can now test the effectiveness of the data and how well it works with your trading strategies and backtesting requirements.

Uses of Amibroker Data Feed Free for Five Days

During the five-day free trial, here are some of the ways you can use the Amibroker data feed for testing and evaluating your trading strategies:

  • Backtesting trading systems – Test your trading systems with reliable data during the trial to assess performance.
  • Building stock screeners – Create and test stock screeners using technical and fundamental parameters without worrying about data feed costs.
  • Algorithmic trading – Start developing and automating rule-based trading strategies while evaluating the quality of the data.
  • Price & financial analysis – Analyze price patterns, trends, and financial ratios of stocks.
  • Portfolio analysis – Use the free data to evaluate the performance metrics of your existing portfolio.
  • Charting & visualization – Plot various graphs and visualizations for analysis during the free period.

The accurately organized data allows you to test any application within Amibroker during the free trial and evaluate how well it fits into your long-term trading strategy.

FAQ on Amibroker Data Feed Free

Can I get support during the trial if I run into issues?

Yes, Amiprofits offering the five-day free trial also provide support during the trial period. Whether it’s installation assistance or troubleshooting data feed issues, you can reach out to the provider’s support team to ensure everything is running smoothly with your Amibroker setup.


What happens after the five-day free trial ends?

After the five-day trial ends, you’ll need to decide whether to continue with a paid subscription to keep accessing the data feed. If you choose not to subscribe, the data feed will simply stop, and you won’t be charged. However, if you found it valuable, continuing with the service is as easy as selecting a plan that suits your needs.

Can I use the free trial for backtesting and live trading?

Yes, absolutely! During the free trial, you can use both historical data for backtesting and real-time data for live trading analysis. The trial provides a complete data feed solution so you can experiment with various features, whether it’s developing a new trading strategy or screening stocks in real-time.

What exactly does the five-day free trial offer?

The five-day free trial allows you to access real-time and historical stock data for Amibroker without any cost. During this period, you can use the data to backtest your trading strategies, analyze price movements, and build stock screeners. It’s a full-featured experience, giving you enough time to evaluate the quality and compatibility of the data feed with Amibroker.

Conclusion

Getting data for Amibroker is crucial for backtesting and analyzing trading strategies for stocks. However, committing to a paid data feed can feel risky without testing it first. The best approach is to utilize a free trial that provides access to reliable data for five days, allowing you to test the service before deciding if it meets your needs.

With a five-day free trial, Amibroker users can explore the service without the need for any upfront payment. This period is perfect for backtesting strategies, building stock screeners, and running algorithmic models to evaluate the quality of the data feed. After the trial, you can decide whether to continue using the service on a paid plan or look for other options.

The video tutorials make installation easy, and free support is often available during the trial if needed. Users can reach out to the provider’s support team for installation or troubleshooting assistance. Once the data feed is configured, traders can make full use of Amibroker’s analysis tools based on the free trial.